Platform health and service status
See uptime, SLO attainment, end-to-end latency, error rates, queues, and the oldest outstanding jobs.
 Book a discovery session
Control plane
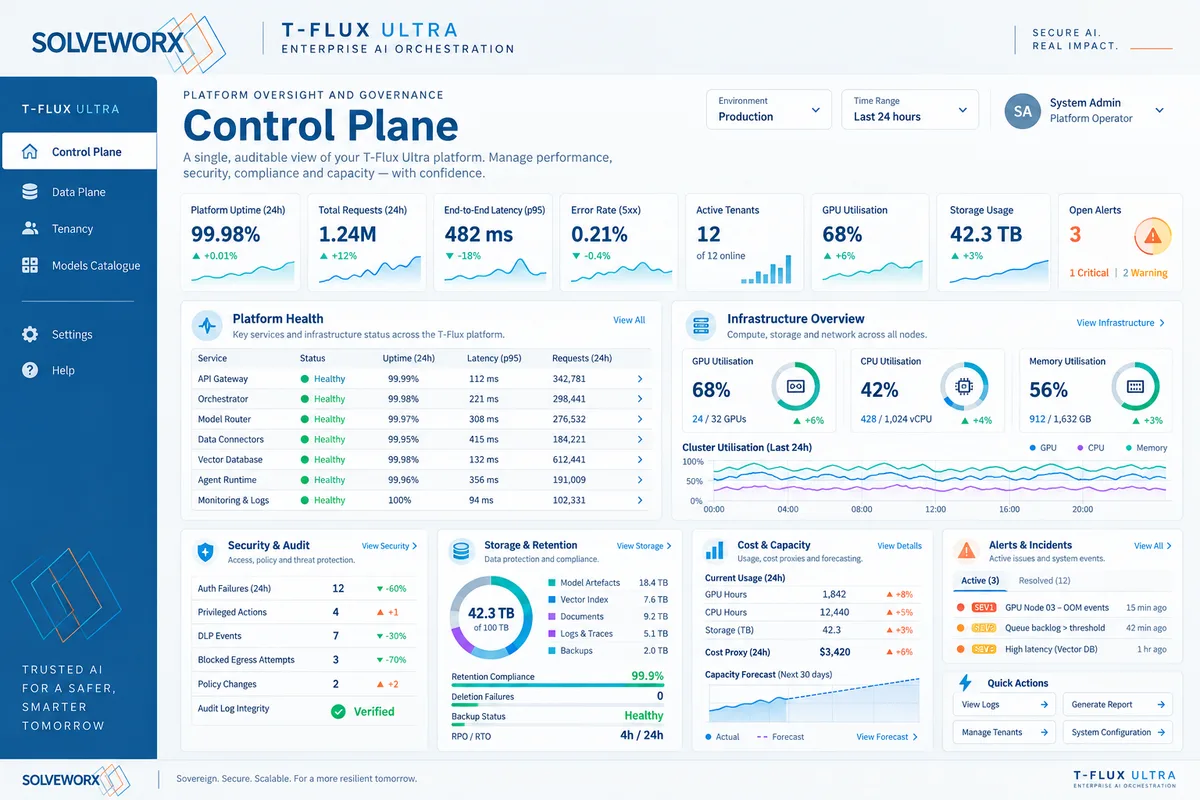
The Control Plane is the central command and governance layer for the entire T-Flux Ultra environment. It provides a single, auditable view of platform health, workload, performance, governance, security posture, and capacity and cost.
It answers one operational question: is T-Flux operating securely, efficiently, and within policy?
One operating view
For single-tenant T-Flux installations in a private cloud or on-premises, the Control Plane brings service status, infrastructure performance, policy enforcement, and governance evidence together for platform administrators, enterprise IT, security, risk, and T-Flux operators.
Core functions
See uptime, SLO attainment, end-to-end latency, error rates, queues, and the oldest outstanding jobs.
Monitor concurrent sessions, storage growth, compute and GPU capacity, workload queues, and resource utilisation.
Bring security posture, access controls, governance policies, audit controls, alerts, incidents, and exceptions into one view.
Review CPU, RAM, disk IOPS, network throughput, GPU utilisation, VRAM, temperature, and power across the environment.
Track GPU-hours, CPU-hours, storage growth, cost proxies, cost per deliverable, and available headroom.
Manage platform configuration, administrative controls, cross-tenant monitoring, and policy enforcement.
Views by role
Service status, consumption, API keys, governance, and billing or cost proxies.
Incidents, queues, latency, infrastructure, logs, and remediation actions.
Policy changes, access events, DLP events, audit integrity, and retention compliance.
Ingestion quality, re-indexing, retrieval health, and corpus change control.
Model routing, throughput, quality KPIs, GPU scheduling, and model failures.
Dashboard coverage
Operational tiles update within ten seconds and governance tiles within sixty seconds, giving teams current, auditable visibility across the platform.
Uptime across 24 hours, 7 days, and 30 days; SLO attainment; latency; requests; concurrent sessions; error budget; queues; and storage growth.
GPU and VRAM utilisation, CPU and memory, disk and network performance, tokens per second, routing distribution, and model concurrency.
Connector throughput, parse and OCR success, embedding queues, vector index health, retrieval latency, cache hit rate, and ACL-filtered retrieval.
Citation coverage, grounding and verification scores, low-evidence refusals, revision rate, corpus changes, policy changes, and guardrail rule hits.
Authentication failures, privileged actions, break-glass usage, DLP and PII events, egress controls, audit integrity, and retention compliance.
API usage, rate limiting, API-key lifecycle, webhook and callback health, retry counts, and integration latency.
Batch jobs, duration distribution, workflow step timings, tool-call failures, retry rate, and poison-pill detection.
Board and audit-ready controls
Surface privileged actions, break-glass use, policy changes outside workflow, DLP events, egress controls, and tamper-evident audit integrity.
Track storage by artefact class, retention compliance, deletion failures, backup and restore status, RPO/RTO posture, and restore-test history.
Forecast GPU-hours, CPU-hours, storage growth, cost proxies, headroom, saturation, and the impact of capacity changes.
Alerts and thresholds
Default SEV1, SEV2, and SEV3 baselines cover availability, latency, error rate, queues, capacity, audit integrity, retention, and security. Every threshold can be configured per tenant and audited.
Below 99.5% daily is SEV2; below 99.0% is SEV1.
p95 latency above target for a sustained period and elevated 5xx errors trigger escalation.
Queue depth, oldest-job age, GPU VRAM, disk utilisation, and vector index health are monitored against thresholds.
Audit-integrity failures, break-glass usage, unauthorised policy changes, and retention failures are surfaced for action.
Drill down and report
Every widget can drill down to request traces, token statistics, model selection, retrieval hits, citations, job details, retries, infrastructure events, and correlated request, job, and document IDs.
One-click exports provide monthly SLA reports, governance and audit reports, and security posture summaries in PDF and CSV formats, each with timestamp, tenant, and signature hash.